remote sensing · geospatial data · applied data science · visualization
Smart Agriculture Dashboard
My master’s thesis brings satellite imagery, weather and field observations together to understand the evolution of an olive grove and provide early warnings of disease.
- Role
- Author of the entire master's thesis
- Period
- January - September 2025
- Status
- shipped
- Visibility
- Case study
Repository kept private while I clean third-party field data. The master's thesis report is public.
The problem
Olive leaf spot is a widespread disease affecting olive groves. It causes leaves to fall and affects the quality of the harvested fruit. Although detection is not complex, infection can remain latent for a long time. The dashboard is designed to monitor the crop and alert when conditions are favourable for the disease to develop.
What I built
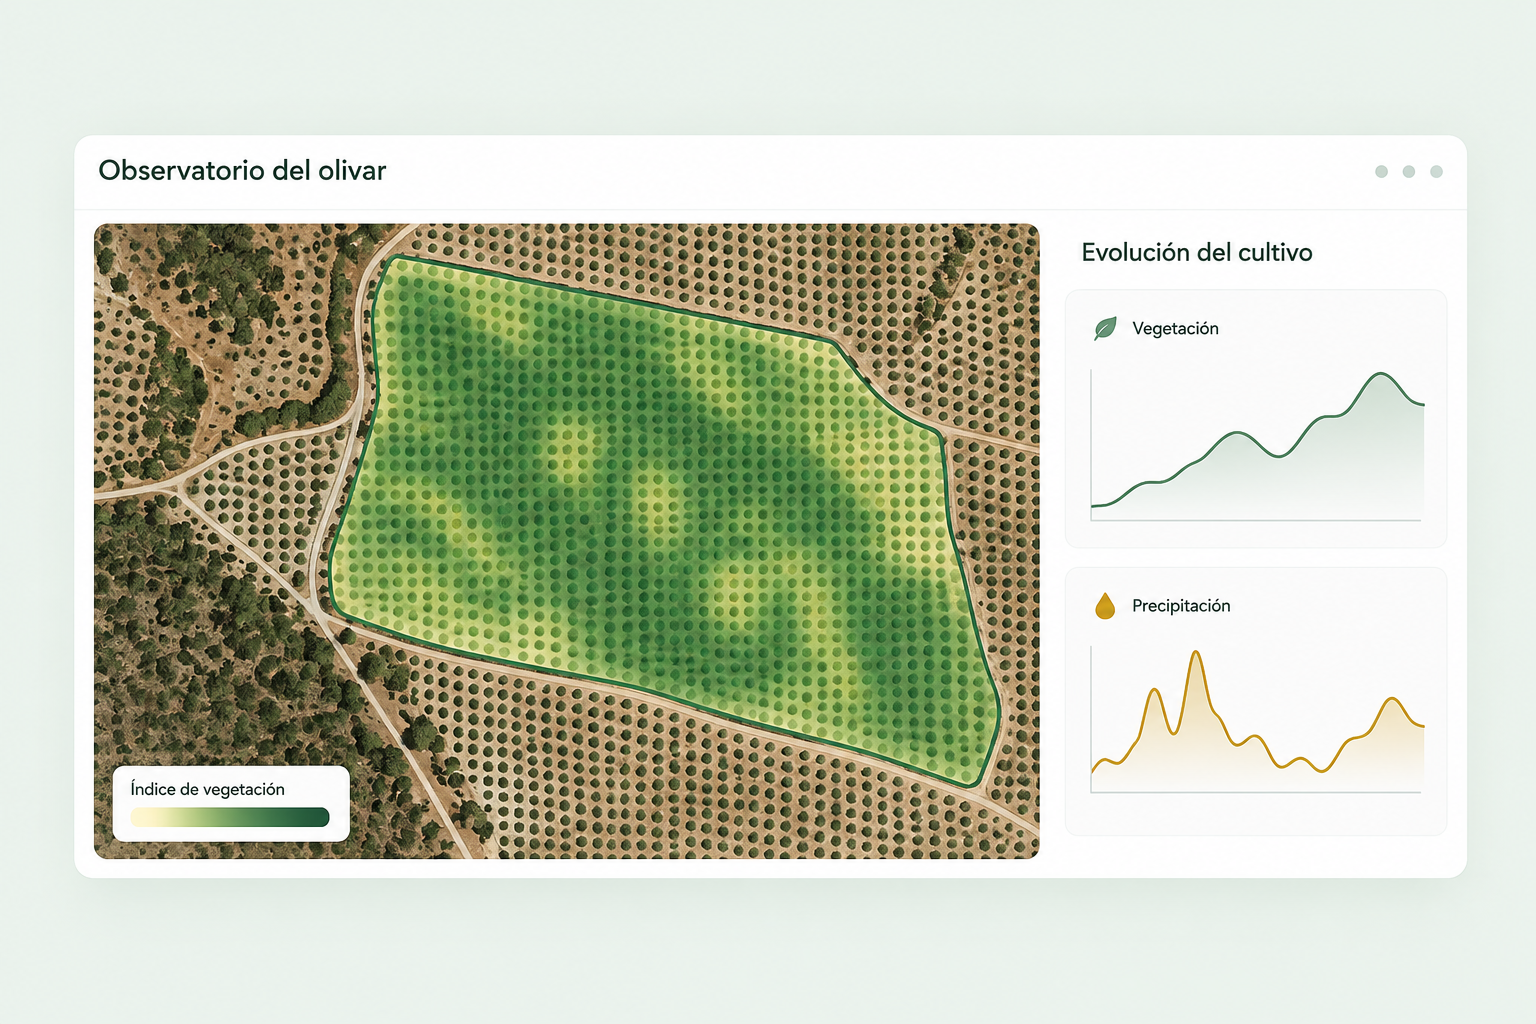
A Python dashboard using Dash and Plotly, integrating Sentinel-2 imagery, vegetation indices, AEMET forecasts and observations sent through a Telegram bot. Users can explore the plot, inspect time series and compare evolution with previous periods.
From data to interpretation
The project covers data acquisition and preparation, caching, visualisation and potential anomaly analysis. Unusual signals help guide inspection.
The image in this case study summarises the dashboard’s purpose. Its curves are illustrative results.
Screenshots